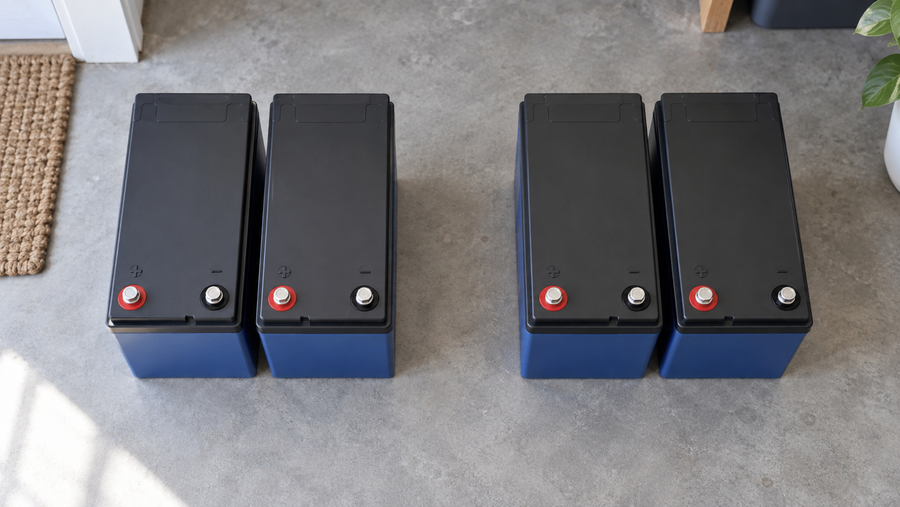

Build fleet battery TCO by season, location, and equipment cohort---not from one annual cycle count or a single replacement date. Each operating period should have its own utilization, charging-window, maintenance, downtime, replacement, and cash-flow assumptions. Then compare lead-acid and LiFePO4 options against the same peak-period operating requirement.
An annual average can conceal the conditions that actually determine the business case. A fleet may have modest activity for much of the year but operate extended shifts during a short peak period. Another site may have seasonal temperature exposure, different terrain or duty cycles, and a different charging schedule despite using the same equipment. Fleet costs can vary with regional conditions, usage patterns, duty cycle, and seasonal temperature changes even when mileage appears similar.
Model the Year as Operating Periods

Start with three practical periods:
- Low season: reduced units in service, shorter shifts, more idle time, or limited charging demand.
- Normal season: representative day-to-day operation.
- Peak season: maximum operating hours, highest equipment availability requirement, and the greatest consequence of an interruption.
Use separate rows for each location and equipment cohort. A cohort might be a group of similar machines that share battery voltage, charger setup, operating environment, and shift pattern.
| Seasonal Input | Low Season | Normal Season | Peak Season |
|---|---|---|---|
| Units in service | |||
| Operating days | |||
| Average operating hours per unit | |||
| Observed battery-related service events | |||
| Available charging window | |||
| Electricity charges recorded for the period | |||
| Maintenance labor and materials | |||
| Spare batteries or substitute equipment used | |||
| Battery-related unavailable hours |
This structure prevents a busy six-week period from being diluted by a quiet off-season. It also gives finance and operations teams a common record: operations supplies utilization and interruption data, while finance assigns the cash and budget treatment.
Do not infer battery runtime, degradation, charging limits, or expected replacement timing from a season label alone. Populate those assumptions from the applicable battery and charger documentation, stated test conditions, and the fleet's own operating records. For a like-for-like comparison, confirm voltage, physical fit, required runtime, charger compatibility, temperature limits, duty-cycle suitability, and the defined end-of-life capacity threshold for both options.
Keep Age, Utilization, and Maintenance Separate
Utilization is not the only lifecycle driver. Age should remain visible as a separate assumption rather than being folded into annual operating hours or miles. Maintenance and repair costs may also change as assets age, so a flat multiyear maintenance allowance can hide risk in later periods.
For each cohort, track:
- Battery purchase and installation date
- Equipment age and planned service horizon
- Seasonal operating hours and observed duty pattern
- Maintenance history and labor time
- Reliability incidents and service calls
- Battery-related downtime, separated from other vehicle or equipment downtime
- Replacement history and current spare inventory
- Resale, redeployment, or residual-value assumptions where relevant
This matters when replacement history is incomplete. A fleet can appear to have stable late-life costs simply because high-cost assets were retired before their most expensive service events were recorded. Keep retired assets and the reason for retirement in the dataset so the model does not treat missing late-life costs as evidence of low risk.
Treat Peak-Period Downtime as a Separate Cost Exposure

Downtime and utilization belong alongside maintenance cost, repair frequency, total cost of ownership, and resale value in fleet decision-making. In a seasonal fleet, the same unavailable hour can have a very different operational impact in February than during the busiest week of the year.
For every peak-season interruption, capture the actual cost components rather than assigning a generic hourly value:
- Record the battery-related unavailable hours.
- Identify whether the unit was replaced, rented, reassigned, or left unavailable.
- Add documented substitute-equipment costs, overtime, dispatch or recovery expense, and emergency service charges.
- Add missed-service penalties or lost contribution only where the fleet can support that value with its own records.
- Separate battery-caused events from unrelated mechanical, operator, or scheduling issues.
The resulting peak-period total can guide decisions about contingency inventory and migration timing. It may justify holding spare batteries, retaining substitute units, scheduling preventive work before the busy season, or phasing a conversion rather than changing an entire cohort immediately.
A structured preventive-maintenance approach can also be modeled as a planned operating cost rather than an after-the-fact repair category. The key is not to assume a universal savings rate for a particular battery chemistry; use the fleet's own labor, incident, and replacement history.
Include Charging and Energy Assumptions by Site

Charging access is a seasonal capacity constraint, not merely an energy-cost line item. A site may have enough charger time in low season but limited overnight or between-shift availability when utilization rises.
For each site and season, document:
- Charger count, availability, and operating schedule
- Actual charging windows by shift
- Battery and charger compatibility requirements
- Electricity charges shown on the site's bills
- Any demand-related charges or time-dependent pricing that appear in those bills
- Extra labor, equipment moves, or spare-battery handling required to maintain service
Enter electricity cost from observed bills or an approved internal forecast, then apply it to the charging activity expected in each period. Do not use one blended annual electricity number if locations have different tariffs, schedules, or peak-season charging patterns.
When comparing alternatives, use the same operating schedule and required service output. A useful next step is to review how charging costs and efficiency assumptions can affect a comparison, then validate the assumptions against the actual equipment and charger arrangement.
Build Replacement Budgets by Cohort, Not by Fleet Average
A single fleet-wide replacement budget can cause a cash surprise when several high-use cohorts reach a decision point before peak season. Instead, group assets by location, application, installation date, and seasonal demand profile.
For each cohort, forecast the following by period:
| TCO Category | What to Capture |
|---|---|
| Upfront cash need | Battery purchase, installation, charger changes, commissioning, and spares |
| Operating cost | Recorded energy charges, maintenance labor, materials, and service events |
| Peak-season exposure | Expected availability requirement, contingency inventory, and downtime cost |
| Replacement timing | Planned replacement window, observed reliability, and documented end-of-life criteria |
| Capital treatment | Depreciation period, financing cost, and budget owner |
| Exit value | Residual, redeployment, or disposal assumptions where applicable |
Avoid approving a replacement solely because a battery or vehicle has reached a particular age, mileage, or annual cycle estimate. A stronger decision includes utilization, reliability, maintenance history, downtime, operational impact, residual value, and total cost.
Run Three Approval Scenarios
Before procurement, test each lead-acid and LiFePO4 option under three cases:
| Scenario | Purpose | Decision Question |
|---|---|---|
| Expected operating year | Uses the current seasonal forecast | Does the option meet the planned budget and service requirement? |
| Earlier or longer peak season | Raises peak utilization or extends the busy period | Does the fleet still have adequate charging access, contingency capacity, and cash headroom? |
| Reduced utilization | Represents a weaker season or delayed workload | Does the investment remain reasonable when savings or avoided replacement events arrive later? |
For every scenario, compare installed cost, seasonal operating cost, maintenance workload, replacement timing, required spares, downtime exposure, financing or depreciation treatment, and residual-value assumptions. Keep the comparison like for like: the same equipment cohort, workload, service target, and operating environment.
A phased pilot is often the clearest choice when sites differ materially. It allows one cohort's operating and service data to refine the next cohort's budget without assuming that all locations will produce the same result.
Prepare the Decision Data Before Migration
The best battery decision is based on the fleet's hardest operating season, not its annual average. Assemble one year of site-level operating, charging, energy, maintenance, downtime, and replacement data; run low-, normal-, and peak-season cases; then use a verified Vipboss specification and application review to determine whether a LiFePO4 configuration fits the fleet's equipment, operating requirements, TCO assumptions, and migration plan.