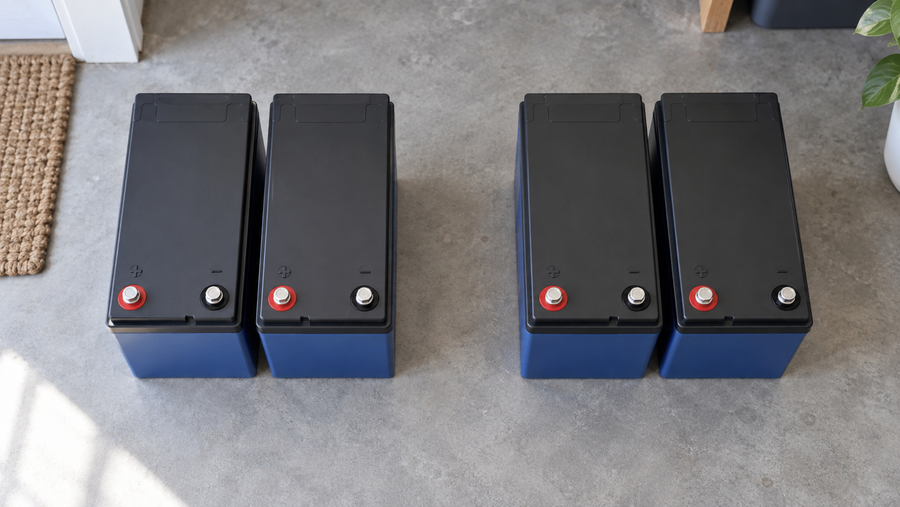

Build the workbook around four linked elements: a controlled asset register, a dated cost-event ledger, a usage-and-life log, and a scenario dashboard. Keep acquisition, operating, maintenance, replacement, downtime, and end-of-life costs separate. Then compare options using the same fleet scope, time horizon, and productive-use denominator.
This structure gives fleet operations, procurement, and finance teams one record for current spending and a practical way to test lead-acid replacement or lithium migration scenarios without reducing the decision to battery purchase price alone.
Start with a Controlled Workbook Structure

A reliable workbook does not need to be complicated, but it does need clear tabs, consistent IDs, and visible assumptions. Create these core sheets:
-
Read Me and Version Log State the workbook purpose, reporting currency, measurement units, reporting period, scenario definitions, and change history.
-
Asset Register Identify every battery and the equipment it supports.
-
Cost Events Record actual invoices, work orders, labor entries, utility allocations, disposal charges, and forecast reserves.
-
Usage and Charging Log Track productive hours, cycle or throughput measures, charging activity, and relevant operating conditions.
-
Assumptions and Scenarios Store editable inputs for labor rates, electricity pricing, expected replacement timing, downtime valuation, warranty treatment, and escalation assumptions.
-
Dashboard Report lifecycle cost, cost per productive-use measure, replacement outlook, and scenario comparisons by site and fleet segment.
Require every input row to include a source, source date, owner, effective date, currency, site, scenario, and validation status. A workbook becomes difficult to audit when figures are hard-coded into summaries or formulas without an identifiable source.
Keep cash events separately coded. Purchase price, lease cost, taxes, installation, connectors, charger work, and commissioning may all belong in the acquisition view, but they should not be blended with depreciation, financing payments, or tax treatment in one headline total.
Build an Asset Register That Supports Decisions
The asset register is the workbook's reference table. It connects spending and usage records to the correct battery, vehicle, equipment group, supplier, and location.
Include fields such as:
| Field Group | Suggested Fields |
|---|---|
| Identification | Battery ID, vehicle or equipment ID, fleet segment, site, department |
| Technical Profile | Chemistry, battery model, rated capacity input, usable-capacity assumption, charger ID, connector type |
| Commercial Profile | Supplier, purchase date, installation date, warranty end date, purchase order or contract reference |
| Operating Status | Active, spare, under repair, retired, disposed, planned replacement |
| Scenario Fields | Baseline chemistry, proposed chemistry, migration phase, assumed replacement date |
Use a controlled list for sites, chemistry, cost types, suppliers, and asset status. This prevents reporting errors caused by slightly different labels for the same location or battery type.
For multi-site operations, assign both a physical site and a reporting region. That makes it possible to review local operating cost while also consolidating procurement, replacement demand, and migration budgets across the fleet.
Create One Cost Ledger for the Full Battery Lifecycle

A battery cost ledger should capture more than acquisition. Fleet lifecycle cost categories commonly include acquisition, operating, maintenance, and disposal costs; battery decisions also need to account for replacement timing, charger compatibility, and operational disruption.
Each ledger row should represent one dated event or one clearly labeled forecast entry.
| Ledger Column | Purpose |
|---|---|
| Date | Transaction, work-order, or forecast date |
| Site and Asset ID | Links the event to a location and battery or fleet segment |
| Scenario | Actual baseline, lead-acid forecast, lithium forecast, or migration phase |
| Cost Group | Acquisition, charging, maintenance, repair, replacement, downtime, disposal |
| Cost Type | Battery purchase, labor, electricity, charger work, connector change, training, temporary disruption, recycling, and similar detail |
| Supplier or Internal Owner | Vendor, maintenance team, or operating department |
| Quantity and Unit | Battery, labor hour, utility allocation, service visit, or other defined unit |
| Amount | Recorded cash amount or forecast amount |
| Allocation Driver | Asset, vehicle, site, productive hour, cycle, or throughput |
| Evidence Reference | Invoice number, work order, meter record, supplier quote, or assumption ID |
| Status | Actual, committed, forecast, reserve, or scenario estimate |
Separate Actuals From Assumptions
Do not mix historical invoices with model estimates in the same reporting line without a status label. Actual cost events show what happened. Forecast reserves and scenario assumptions show what may happen under defined conditions.
For example, a replacement forecast should include more than the projected battery purchase. It may also carry installation labor, commissioning, procurement delay, temporary equipment disruption, and any associated charger or connector work. Downtime deserves its own category because unavailable equipment can create lost productivity, even though each organization must define how it values that effect.
A migration scenario should also isolate costs that do not exist in the current-state baseline, including:
- Charger compatibility checks, replacement, or programming changes
- Connector and electrical modifications
- Installation and commissioning
- Training and updated operating procedures
- Site infrastructure changes
- Temporary operational disruption during rollout
- Phased deployment and overlap costs
Link Usage to Life and Replacement Planning
Cost per battery is useful for purchasing. Cost per productive use is more useful for fleet management.
Create a usage log at the asset or equipment-group level with these fields:
| Usage Field | Why It Matters |
|---|---|
| Reporting Period | Establishes the time basis for every measure |
| Site and Asset ID | Connects use to the correct cost history |
| Productive Operating Hours | Supports cost-per-hour reporting |
| Battery Changes or Charge Events | Helps explain labor and operational patterns |
| Cycle Count or Ah Throughput | Provides the selected life-tracking measure |
| Depth-of-Discharge Assumption | Documents the cycle definition used |
| Temperature or Operating Condition Notes | Preserves context for service-life assumptions |
| Maintenance and Repair Events | Links operating experience to cost records |
| Downtime Hours | Supports replacement and disruption planning |
For conventionally charged motive-power equipment, document one consistent cycle definition. One supported convention is a discharge and recharge within 24 hours at 80% depth of discharge. Do not apply that definition automatically to every operating pattern.
For opportunity- or fast-charged fleets, accumulated ampere-hour throughput can be a more appropriate tracking measure than cycle count. The key is consistency: do not compare one fleet segment by cycles and another by throughput without making the difference visible on the dashboard.
Use the same denominator across scenarios. If the comparison is cost per productive operating hour, both lead-acid and lithium scenarios should use the same productive-hour scope. If the comparison is cost per vehicle or per site, include the same equipment population and reporting period.
Treat service-life inputs as editable assumptions, not guarantees. Charging discipline, temperature, and maintenance consistency can affect service-life expectations, so the workbook should record the assumption owner, effective date, and confidence level.
Build a Dashboard for TCO and Migration Decisions

The dashboard should answer a small number of operational questions quickly:
- What is the current lifecycle cost by site, equipment type, chemistry, and supplier?
- Which fleet segments have the highest cost per productive hour, cycle, throughput unit, vehicle, or site?
- Which batteries are approaching planned replacement timing?
- What costs are driving the difference between baseline and migration scenarios?
- What capital work is required before a battery change can proceed?
- How does the result change when utilization, labor, electricity, replacement timing, or downtime assumptions change?
Use filters for site, equipment type, fleet segment, chemistry, supplier, battery status, and scenario. Display baseline and proposed options side by side with the same start date, equipment count, time horizon, allocation rules, and productive-use measure.
Keep four views separate:
- Operating Cash Flow --- acquisition, energy, labor, maintenance, repair, replacement, downtime, and end-of-life cash costs.
- Capital and Migration Spend --- battery purchases, chargers, connectors, installation, commissioning, and site changes.
- Accounting View --- depreciation and other organization-specific accounting treatment.
- Financing or Lease View --- payments and terms that should not be mistaken for operating cost.
A lithium migration should pass a system check before it becomes a financial conclusion. Battery and charger should be evaluated together, and charger programming should match battery chemistry. Add a dashboard field for compatibility status: unreviewed, compatible, requires modification, or not approved for the scenario.
If you need to develop the charging-cost inputs further, this guide to lithium versus lead-acid efficiency and charging costs can help frame the questions to validate with site utility and equipment data.
Add Sensitivities Before Making a Commitment
A single "best case" is not a budget. Create at least a conservative base case and sensitivity cases for the assumptions most likely to change the decision:
- Productive operating hours and seasonal utilization
- Electricity rate and charging allocation method
- Maintenance labor and battery-change labor
- Expected replacement timing
- Failure or repair reserve
- Downtime cost assumption
- Battery and installation pricing
- Charger, connector, and infrastructure scope
- Warranty treatment and end-of-life cost
- Replacement schedule by site or fleet segment
Label every scenario input as measured actual, supplier document, internal estimate, or management assumption. This distinction is often more valuable than a more elaborate dashboard because it shows which conclusions rest on verified records and which depend on estimates.
Start with a current-state baseline for one site or equipment group. Validate the highest-value assumptions with invoices, maintenance logs, utility data, and supplier documents. Run a conservative base case plus sensitivities, then expand to multi-site consolidation or a phased migration scenario. Bring the completed inputs---not just a desired battery price---to Vipboss for a documented fit, compatibility, and quotation discussion.