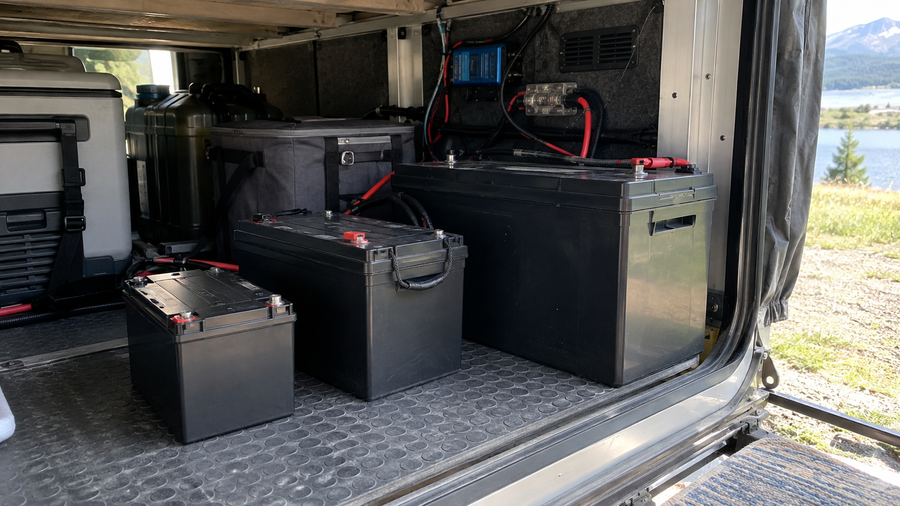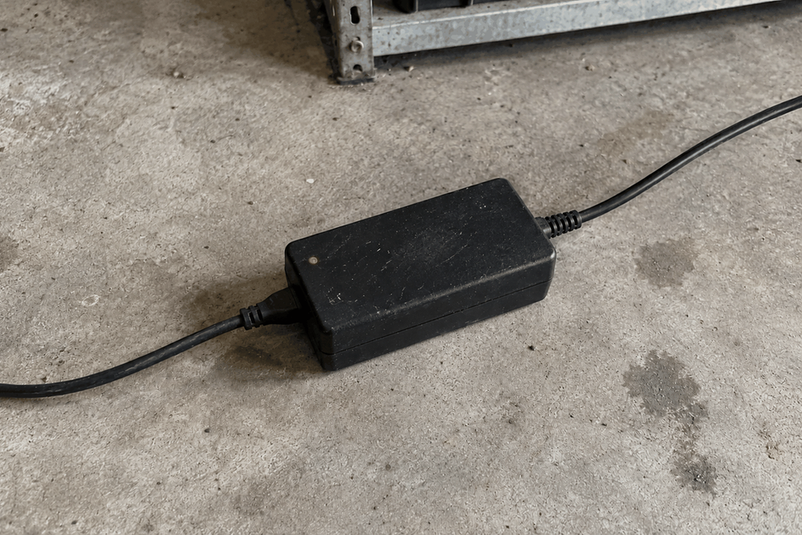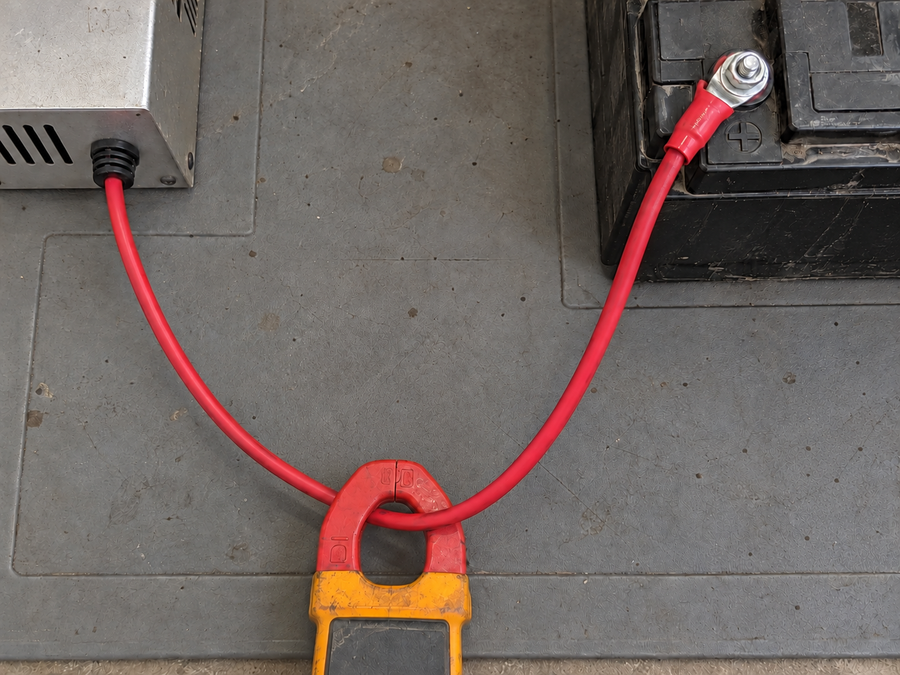

Calculate payback by comparing the full incremental installed cost of a commercial LiFePO4 upgrade with the annual net cash benefit of continuing to operate lead-acid batteries. Start with a like-for-like service comparison—not battery purchase price or nameplate capacity—then track when cumulative savings recover the conversion cost.
Build the model separately by truck class, site, shift pattern, and seasonal operating period. A fleet with different daily hours, charging windows, tariffs, and battery-change practices should not rely on one fleet-wide assumption. Before approving a rollout, test conservative, base, and upside cases.
Define the Baseline Before Comparing Technologies
The lead-acid baseline is the cost of delivering the required work if the fleet does not convert. It should reflect the current operation as it actually runs, including battery age, replacement timing, charging practice, labor tasks, and utilization.
Collect baseline inputs for each truck group or site:
- Vehicle type and current power source
- Daily operating hours and number of shifts
- Seasonal changes in utilization
- Battery age, purchase history, and expected replacement timing
- Current charger arrangement and charging windows
- Electricity invoices, tariff periods, and peak versus off-peak exposure
- Watering, equalization, maintenance, and battery-change activities
- Labor rates and the paid time associated with those activities
- Documented downtime or lost throughput attributable to battery processes
The lithium case must deliver equivalent operational availability. A lower battery count or different charging pattern may be workable, but only if the equipment can complete its required duty cycle with the proposed charging plan.
For a deeper review of the charging assumptions that can affect the energy line, see lithium versus lead-acid efficiency and charging costs.
Choose the Metric That Matches the Approval Decision
Simple payback is usually the first screening tool. It answers a straightforward question: how long will annual net savings take to recover the additional cash invested at conversion?
It is useful for an early capital decision because it is easy to audit. However, it does not reflect the time value of money or distinguish between savings received earlier and savings received later.
| Metric | What It Helps Answer | Best Use |
|---|---|---|
| Simple payback | When does cumulative net benefit recover the incremental investment? | Initial project screening |
| Discounted payback | When does the project recover its investment after applying the organization’s approved discount rate? | Capital approvals where timing matters |
| ROI | How large is the return relative to investment over the selected period? | Comparing project scale or reporting returns |
| NPV | Does the project create value after accounting for the required return on capital? | Comparing competing capital projects |
Use simple payback to identify whether the project merits further work. Escalate to discounted payback or NPV when the project competes with other investments, requires financing, or produces material benefits in later years rather than immediately.
A five-year view can be a useful planning convention for displaying replacement timing and cumulative cost, but it should not be treated as a universal battery-life or payback horizon.
Build a Complete Installed-Cost Model

The Year 0 investment is not simply the price of the LiFePO4 batteries. It is the net cost of putting a compatible, operational system into service.
Start with the quoted battery package, then add every conversion cost that must be paid before the fleet can operate.
| Year 0 Cost Category | Input to Collect |
|---|---|
| LiFePO4 batteries | Quantity, installed price, and delivery scope |
| Chargers or charger work | New chargers, compatibility work, or charger replacement |
| Connections and electrical work | Connectors, cabling, electrical-service changes, and related labor where quoted |
| Installation and commissioning | Installation labor, setup, testing, and commissioning |
| Software or monitoring | Only when included in the project scope |
| Training | Training costs that are part of the conversion plan |
| Retired-battery handling | Removal, disposal, recycling, or credits where applicable |
| Contingency | A stated allowance for unresolved installation items |
Then subtract only those lead-acid costs that are genuinely avoided at conversion. For example, if the fleet would otherwise need an immediate lead-acid battery purchase, that avoided purchase can reduce the incremental investment. A lead-acid replacement expected later should remain in the year it is actually expected to occur.
This timing discipline matters. Do not turn a future avoided replacement into an immediate annual saving. Enter it as a cash-flow benefit in the expected replacement year.
For each technology, record:
- Purchase price per battery
- Expected operating lifetime used in the model
- Expected replacement events during the planning period
- Charger costs and related project scope
- Any remaining lead-acid assets or usable inventory
A phased rollout can reduce the initial capital requirement, but it also changes the timing of both costs and benefits. Model each phase separately rather than assuming the economics of one truck group automatically apply to the entire fleet.
Calculate Annual Savings From Operating Evidence
Annual net savings should include only benefits that can be measured, documented, or operationally captured. The most credible models separate each savings line into measured, assumed, or excluded.
| Savings Line | Use in the Base Case When | Keep Out of the Base Case When |
|---|---|---|
| Energy-cost change | Consumption, tariff exposure, charging efficiency assumptions, and charging periods are supported by site data | Opportunity-charging effects or tariff treatment are speculative |
| Watering and equalization labor | The tasks, frequency, paid hours, and labor rate are documented | Saved time does not reduce paid hours or create usable capacity |
| Battery maintenance labor | Maintenance records identify labor and material costs | The maintenance estimate is based on a generic industry claim |
| Battery-change time | Time per change and frequency are observed by truck or shift | The operation cannot use the time released |
| Avoided battery replacement | The replacement schedule and avoided purchase are documented | The replacement date is uncertain or beyond the model horizon |
| Downtime or productivity value | Lost output, overtime, or recoverable capacity is demonstrated | The value is assumed without a measurable operational consequence |
| Training costs | Costs are part of the rollout plan | Training is not yet defined or assigned |
Model Energy Costs by Charging Pattern
Use actual electricity invoices and site tariff periods where possible. The model should reflect:
- Electricity rate by applicable period
- Charging efficiency assumption for each option
- Peak and off-peak charging exposure
- Operating hours by shift
- Seasonal utilization
- Charging windows available to each truck group
Do not assume that a different charging pattern automatically lowers energy cost. The direction and size of the result depend on the site’s measured consumption, tariff structure, and when charging occurs.
Value Labor Only When It Becomes Economic Capacity
Watering, maintenance, and battery-change time are valid operating variables, but time saved is not automatically cash saved.
A labor benefit belongs in the base case when the released time produces one of the following outcomes:
- Fewer paid labor hours
- Avoided overtime
- Redeployment to work that would otherwise require added labor
- Measurable throughput or uptime improvement
If staff remain on the same schedule and the released time has no captured operational value, show it as a qualitative benefit or an upside-case input rather than guaranteed savings.
The same rule applies to downtime. Assign a value only when records show a recoverable loss, such as overtime, delayed work, rented equipment, or constrained throughput.
Build the Cash-Flow Timeline
Once costs and savings are defined, create a year-by-year cash-flow schedule. In Year 0, enter the incremental installed cost. In later years, enter energy changes, realized labor and maintenance changes, and replacement purchases or avoided purchases when they are expected to occur.
The simple-payback point is reached when cumulative net benefits equal or exceed the initial incremental investment.
For discounted payback, use the same schedule but apply your organization’s approved discount rate to each future cash flow before accumulating it. This prevents a project with distant savings from appearing equivalent to one that produces savings earlier.
A useful model distinguishes between:
- Recurring annual items, such as verified maintenance or energy changes
- One-time conversion items, such as installation and commissioning
- Timed replacement events, such as avoided lead-acid purchases
- Conditional benefits, such as labor capacity that depends on a staffing or throughput decision
Test Conservative, Base, and Upside Cases

A single payback result can hide the assumptions carrying the project. Create three cases that use the same structure but different support levels.
| Scenario | Inputs to Use | Decision Value |
|---|---|---|
| Conservative | Lower utilization, limited labor realization, cautious replacement timing, full installation scope, and uncertain benefits set to zero | Tests whether the project remains viable under restrained assumptions |
| Base | Measured operating data and documented operational plans | Supports an approval recommendation |
| Upside | Higher utilization, captured labor capacity, favorable charging exposure, or validated productivity gains | Shows potential, but should not justify the project alone |
Stress-test the inputs most likely to change the decision:
- Annual operating hours and seasonal demand
- Electricity tariff exposure and charging windows
- Charging efficiency assumptions
- Realization of maintenance and battery-change labor savings
- Timing of battery replacement purchases
- Installation and charger scope
- Rollout scale by site or truck class
Calculator output is only as reliable as the inputs supplied. A general calculator also cannot replace a model-specific review of duty cycle, compatibility, performance requirements, and warranty terms.
Use the Result to Choose the Next Step
A favorable base case is not enough if the conservative case fails because of unresolved compatibility, installation, or utilization assumptions. Use the confidence of the inputs alongside the payback result.
- Proceed to quote and site survey when the conservative case meets the organization’s approval threshold and the installed scope is defined.
- Review financing or leasing when the economics are sound but the upfront cash requirement is the obstacle. Treat financing as a cash-flow decision, not as a reduction in total project cost.
- Run a controlled pilot when the opportunity appears credible but duty cycles, charging behavior, or labor realization remain uncertain.
- Phase the migration when different sites or truck classes have materially different utilization and economics.
- Delay or redesign the project when the base case relies on unmeasured savings or unresolved infrastructure costs.
Approval Checklist
Before approving a commercial battery installation, confirm that you have:
- Verified the lead-acid baseline by truck, site, shift, and season.
- Requested a complete installed-cost and compatibility scope, including chargers and conversion work.
- Placed replacement costs and avoided purchases in their actual expected years.
- Run conservative, base, and upside scenarios with labor and downtime benefits included only when they are operationally recoverable.
- Confirmed that model-specific duty-cycle and warranty review supports the proposed deployment.
- Checked applicable electrical, safety, accounting, recycling, tax, and incentive requirements with qualified local professionals.
If the economics are credible but the operating inputs remain uncertain, a site-specific Vipboss assessment or controlled pilot can supply the data needed for a defensible rollout decision.