
This guide explains battery C-rate as fuel-flow speed so you can size, operate, and protect an off-grid lithium bank with confidence.
You hook up a new lithium bank, fire up the well pump and microwave together, and watch the monitor scream as current spikes and voltage sags. That uneasy feeling that you are abusing the batteries is usually your gut noticing that energy is being pulled or pushed too fast. Once you give that feeling a number—the C-rate—it becomes straightforward to size banks, inverters, and chargers so your off-grid system can work hard when needed and still last for years.
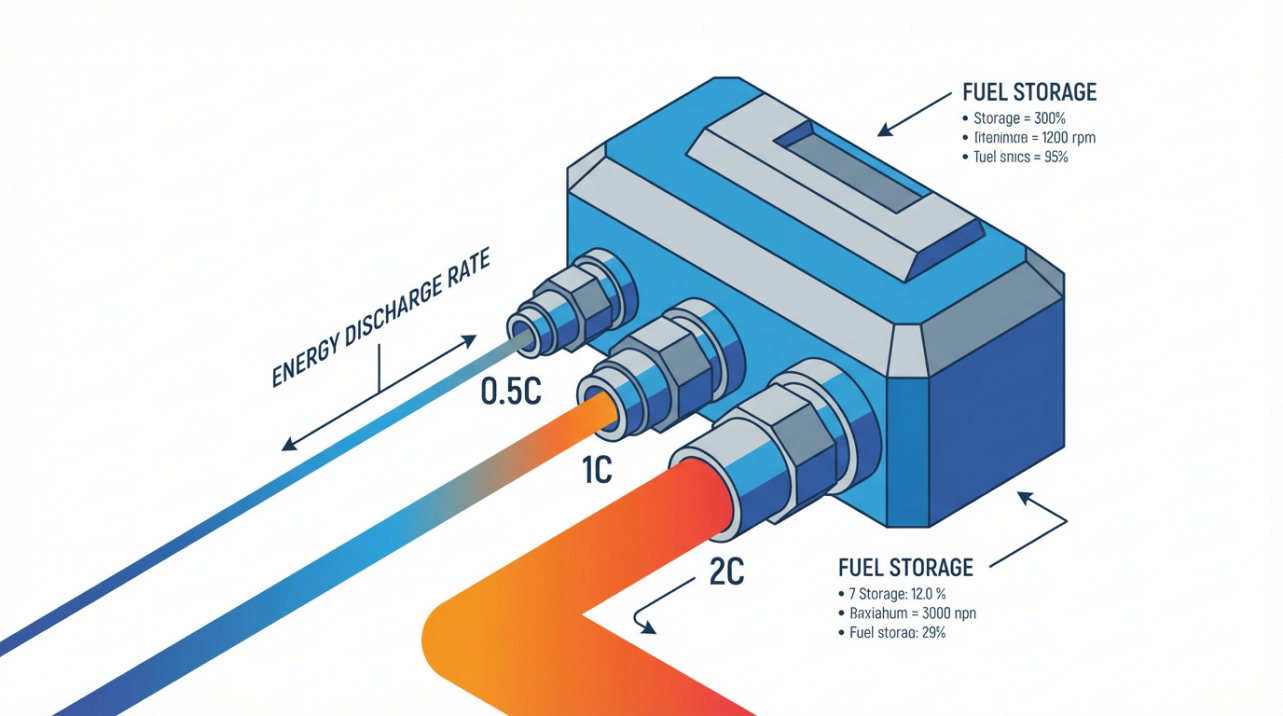
C-Rate in Plain Language: Flow Speed from a Tank
Battery C-rate is the charge or discharge rate normalized to capacity. A rate of 1C means the battery would be filled or emptied in about one hour, 0.5C in about two hours, and 2C in roughly half an hour, just as changing the nozzle on a fuel tank changes how fast it drains. Technical references define C-rate as current divided by rated capacity and express it as 0.5C, 1C, or 2C instead of only amps or watts, because the same 50 A is gentle on a large bank and brutal on a small one. Battery C‑rate explainers and pack design guides both anchor on this normalized view.
In practical terms, C-rate tells you two things at once: how hard each cell is working and roughly how long you can sustain that work. With a 100 Ah lithium battery, 1C is 100 A and, in an ideal lab, gives about one hour of runtime; 0.5C is 50 A for about two hours; 2C is 200 A for around 30 minutes. Designers use the same idea at larger scales: a 100 MWh storage plant running at C/2 is a 50 MW system, and at 4C it is 400 MW, which shows that C-rate is also a primary sizing dial for serious battery storage.

C-rate |
Approx. full-charge or full-discharge time |
Flow analogy |
0.05C |
20 hours |
Tiny drip from the tank |
0.1C |
10 hours |
Slow, steady trickle |
0.5C |
2 hours |
Garden hose fully open |
1C |
1 hour |
Fire hose you can still manage |
2C |
30 minutes |
Fire hose trying to rip free |
Turning C-Rate into Real Numbers on Your System
Once you know your system voltage and bank size, C-rate is one division away. Suppose your off-grid cabin runs a 48 V, 200 Ah LiFePO4 bank. That bank has 200 Ah of capacity, so 1C is 200 A. If your inverter is feeding a 4,800 W load, the DC current is roughly 4,800 W ÷ 48 V ≈ 100 A, so the pack is operating at about 0.5C. If you bump loads up to 9,600 W for a big shop tool plus house loads, the DC current climbs toward 200 A, or about 1C for that same bank.
The same math works for charging. If that 48 V, 200 Ah bank sees 60 A from a solar charge controller, that is 60 ÷ 200 = 0.3C; a 100 A charger on the same bank is 0.5C. References on lithium C-rating show that many LiFePO4 and NMC batteries are designed for around 1C continuous discharge with higher short bursts, and often recommend charge rates of 0.5C or less to balance speed with life. Typical values and examples, such as a 100 Ah battery delivering 100 A at 1C or 300 A at 3C, are laid out clearly in lithium C‑rating overviews.
Product designers also talk about power in terms of C-rate rather than just watts. A 1C discharge rate is the baseline power capability; at 5C, the same cell delivers about five times the power but only for roughly one-fifth the time, which is exactly what you see in high-power tools or snowblowers compared with wearables and phones that sip slowly at low C-rates. That link between C-rate and how hard the pack can punch is highlighted in modern discussions of battery power and performance metrics.
Why Pour Speed Changes Runtime and Battery Life
Amp-hours are not absolute. When you drain a battery fast, more energy turns into heat and less into useful work, so usable capacity shrinks as C-rate rises. Laboratory data and field guides show that discharging cells at higher C-rates reduces measured capacity compared with gentle, low-C tests. The same 1 Ah test cell might give more than 100% of its nameplate capacity at 0.5C but noticeably less at 2C, even though the simple math suggests the same energy should be available. That C-rate-dependent capacity behavior is a standard result in battery tests.

For off-grid users, a classic example is the 12 V, 100 Ah lead-acid battery. Run it at about 0.05C, which is only 5 A, and it can deliver power for over 20 hours. Slam it at 1C, or 100 A, and instead of one hour you may see just over 30 minutes before hitting the end-of-discharge voltage. The label still says “100 Ah,” but the real-world runtime swings widely because the pour speed is different. That is why many lead-acid batteries are rated at a gentle “20-hour rate,” effectively hiding how quickly capacity falls off at higher C-rates.
The same story plays out for life, not just runtime. High C-rates push more current through the same internal structure, raising resistive heating, stressing the electrodes, and accelerating side reactions that permanently steal lithium or active material. Pack-design articles and manufacturer data consistently warn that frequent operation at high C-rates shortens cycle life and increases the risk of thermal and safety issues, so their recommended operating windows keep daily use well below the absolute maximum C-rating printed on the cell.
This trade-off between high-C power and long-term capacity retention is a central design constraint in battery pack C-rating guides.
Long-term studies on lithium packs show this in numbers: when cells are cycled continuously at around 1C, capacity fades much faster than when they are charged and discharged at moderate rates around 0.2-0.5C, with some test series reporting life extensions on the order of a third when C-rate is dialed back into that gentler band instead of pushed hard every cycle. For off-grid use, that translates into a simple rule of thumb: the more days you are willing to take it easy on charge and discharge speed, the more years you tend to get before your lithium bank feels tired.
Depth of discharge adds another layer. Lead-acid batteries repeatedly taken all the way down deteriorate rapidly; limiting them to around 30% depth of discharge can turn a few hundred cycles into well over a thousand. Lithium chemistries tolerate deeper discharge but still reward restraint: cycling only the middle 50–70% of capacity at moderate C-rates noticeably stretches usable life compared with hammering the full 0–100% at high C.
Designing Lithium Retrofits: Choosing Your Target C-Rate
When upgrading from lead-acid to lithium in an off-grid or backup system, the most important design decision is how hard you intend to run the bank on its worst day, and C-rate is your gauge. Start by looking at your heaviest realistic load combination and dividing that power by your DC bus voltage to get current. Then divide by your planned amp-hours to get a worst-case discharge C-rate. Do the same on the charge side using your maximum solar and generator charging current.
Consider a 48 V system where you want to support a 5,000 W combined house and shop load. The DC current is roughly 5,000 ÷ 48 ≈ 104 A. With a 200 Ah bank, that is about 0.52C; with only 100 Ah of lithium, it doubles to roughly 1.04C. Many lithium home-storage and solar batteries are engineered to operate around 0.5–1C continuous discharge, with a similar or slightly lower band recommended for sustained charging, and their datasheets treat these bands as the sweet spot between performance and longevity. Real-world examples for solar-oriented LiFePO4 packs show sustainable charge rates around 0.5–0.8C and discharge around 1C, trading away some extreme peak capability for cooler operation and better cycle life.
On the charging side, imagine your 48 V, 200 Ah bank has a solar array and charge controller capable of 80 A. That is a charge C-rate of 80 ÷ 200 = 0.4C, comfortably in the mid-range. If you later add a generator-driven charger that pushes 150 A, your peak charge rate jumps to 0.75C. Residential and EV references both point out that slower C-rates such as 0.2–0.5C, especially for overnight or daily charging, reduce thermal stress and prolong life, while reserving higher C-rate charging for short windows when time really matters. That pattern—routine low-C charging and occasional high-C top-ups—is exactly what is recommended for EVs in discussions of charge and discharge rates.
This is also where parallel strings shine. If you double bank capacity from 200 Ah to 400 Ah while keeping the same loads and chargers, every C-rate is cut in half: that 5,000 W load becomes roughly 0.26C, and the 80 A charger drops to 0.2C. Pack-level behavior at a given current becomes gentler on each cell, which is why designers often add parallel capacity rather than running one small pack at a high C-rate all day.
Finally, match C-rate targets to your mission. Devices that need short bursts of very high power, such as power tools, may be designed for C-rates of 5C or more and discharge fully in about 12 minutes, while grid and home storage typically live down near 0.1–0.5C with discharge times of 2–10 hours. Those application-specific C-ranges, from power tools through EV traction packs to long-duration grid storage, are laid out clearly in C-rate application maps and energy storage C-rate notes.
Temperature and Seasons: The Hidden C-Rate Trap
Most C-rates and capacities are specified at conditions around 77°F, but no off-grid cabin or shop lives in a climate-controlled lab. As the temperature drops toward freezing and below, the electrolyte thickens, lithium ions move more slowly, and internal resistance rises, so what looked like a safe high C-rate at room temperature can become abusive in a cold battery. Both EV performance studies and detailed laboratory work show that fast charging at high C-rates in cold conditions sharply accelerates degradation, often due to lithium plating on the anode and other failure mechanisms that appear well before the same C-rate would cause trouble at warmer temperatures. This temperature-dependent penalty is a key theme in analyses of EV charging C-rates.
On the discharge side, hot weather encourages faster reactions but also intensifies aging if C-rate and temperature are both high. Long-term experiments on lithium cells show that at elevated temperatures, raising C-rate increases heat generation even more, which in turn compounds stress on separators and electrode interfaces. At very low temperatures, research on lithium iron phosphate and graphite/NMC chemistries has documented cases where cells that survive thousands of cycles at moderate C-rates near 77°F lose most of their capacity after only dozens of fast-charge cycles at temperatures closer to 40–50°F, underlining how strongly the safe C-rate window shrinks when it is cold.

In practical off-grid terms, if your bank lives in an unheated shed that sees hard freezes, it is wise to mentally derate both your allowable C-rate and usable capacity in winter. That might mean treating a “1C-capable” lithium bank as if it were a 0.5C system until it warms up, spreading large loads across more capacity, or allowing more generator run time at lower charge currents instead of forcing the highest-amp charger into a cold pack. Likewise, in very hot environments, active ventilation or thermal buffering around the battery room can make the difference between a pack that tolerates higher seasonal C-rates and one that quietly cooks itself over a couple of summers.
Simple Fuel-Flow Checks You Can Do Now
You do not need a lab to put C-rate to work; a basic monitor and a few back-of-the-envelope calculations are enough. During your heaviest normal load—maybe a winter evening with well pump, fridge, lights, and a power tool running—note the inverter DC current and divide it by your total amp-hours to see your live discharge C-rate. If that number routinely sits at or above 1C, especially on a relatively small bank, you are effectively running with the fuel tap wide open and should consider either adding capacity or smoothing out peak loads.
Next, watch charging. On a sunny day at peak solar, note the maximum charge current from the controller, divide by your bank capacity, and record that C-rate. Do the same with your generator charger. If one of those routinely charges at a C-rate the manufacturer only allows as a short-term peak, dialing that current back is one of the easiest ways to buy longer life without changing hardware. On many systems, simply capping charge C-rate around 0.3–0.5C for daily use, while allowing occasional higher bursts when time is tight, gives a strong balance of quick recovery and long service life, reflecting the moderate-C recommendations seen across both lab studies and practical design guides.
Finally, keep notes by season. If you notice that the bank feels weaker or errors appear more often on very cold mornings or hot afternoons when currents are high, treat that as a clear sign that temperature and C-rate are interacting and tighten one of the two. That might be as simple as delaying large loads until the bank has warmed up a bit or tilting your charging schedule so the hardest charge period happens when cells are near room temperature.
FAQ
How high is “too high” for C-rate on a lithium off-grid bank?
The hard limit is whatever your battery datasheet lists as its continuous and peak C-ratings, and those limits must never be exceeded. In practice, daily operation that stays around 0.2–0.5C for charging and roughly 0.5–1C for discharging is a good target band for many LiFePO4 and NMC storage batteries, while brief higher bursts are reserved for surges such as motor starts or occasional fast charging. This pattern of moderate normal use and limited high-C events is consistent with both storage-focused C-rate guidance and the behavior recommended for EV packs in analyses of charge and discharge C-rates.
Does a higher C-rated battery always mean a better upgrade?
A higher C-rated battery can safely deliver more current relative to its capacity, which is useful for tools, vehicles, or systems that demand short bursts of intense power, but it is not automatically better for fixed off-grid storage. Higher C capability often comes with trade-offs in cost, efficiency, and sometimes long-term life if that capability is used aggressively in a hot environment. For many cabins, homes, and small commercial sites, pairing a moderate C-rated lithium battery with enough total capacity to keep everyday C-rates low gives a better mix of uptime, lifespan, and economics than buying extreme high-C cells and running them near their limits.
How does C-rate help when comparing inverters and batteries?
C-rate gives you a common language to match inverter power to bank size. Instead of just checking that a 6,000 W inverter has a big enough battery, you convert that power into DC current at your system voltage and then into C-rate for your actual amp-hours. If that calculation shows the inverter would pull the bank at 1.5–2C for the loads you care about, you know that either the bank should be larger or the inverter capacity should be treated as peak only, not a continuous rating, unless the cells and cooling are designed for that level of stress.
A clear mental picture of C-rate as fuel-flow speed lets you design and run lithium retrofits with intent instead of guesswork. Once you get used to thinking in C-rate, you stop asking only “How big is my bank?” and start asking the more powerful question: “At this speed of pour, how long will it stay healthy?”