
State of health (SOH) is most useful as a trend, not a verdict. A reading such as 92% says little by itself unless you know what the number represents, how it was estimated, and whether the test conditions resemble earlier readings.
Over several years, the practical question is not “What is my battery’s SOH today?” It is “How has the battery changed under comparable conditions, and has the pattern changed enough to require investigation?” The framework below helps you answer that without mistaking normal measurement noise for permanent damage.
Define what your SOH number actually represents
SOH is a comparison between a battery’s present condition and a reference condition, usually when it was new. It is not a directly measured physical quantity: a battery-management system (BMS) estimates it from signals such as voltage, current, temperature, usage history, and charging or discharging behavior. Depending on the system, SOH may emphasize usable capacity, power capability, internal resistance, or a combination.
That makes the label important. Record the source of every value—BMS display, diagnostic app, capacity test, service report, or your own calculation—and keep the definition with the data. Do not assume that 90% from one battery-management system is directly comparable with 90% from another. Proprietary BMS algorithms and reporting conventions differ, as recent cross-manufacturer research illustrates in its discussion of SOH comparability.
If your goal is runtime, capacity-based SOH is usually the most relevant measure. If the problem is voltage sag, heat, or inability to deliver a high load, a power or resistance indicator may tell a different story. A long-term record can contain both, but they should not be combined into one unexplained line.
Build a comparable multi-year record
Create one row for each observation rather than keeping only an annual average. A useful record can include:
| Field | Why it matters |
|---|---|
| Date and battery age | Establishes the time axis and separates calendar aging from usage intensity. |
| SOH value and source | Preserves the number and how it was produced. |
| Capacity, if available | Provides a more concrete basis for a capacity trend. |
| Charge/discharge throughput or equivalent cycles | Shows how much work the battery has performed. |
| Temperature or ambient conditions | Helps identify readings affected by heat or cold. |
| Starting and ending state of charge | Makes test comparisons more meaningful. |
| Current, load, cutoff, and test duration | Explains why two capacity tests may disagree. |
| Firmware, monitor, or BMS changes | Flags a possible break in the time series. |
| Events and operating context | Captures storage, unusual loads, long downtime, or service work. |
Use the same units, clock convention, battery identity, and data source wherever possible. If a monitor or BMS is replaced, keep the old and new series separate until you have evidence that their values are comparable.
For capacity checks, repeat the same test protocol and follow the battery maker’s instructions. Temperature, discharge rate, starting charge, cutoff voltage, and test equipment can all affect the result; controlled conditions are essential when comparing results as this SOH measurement guide explains. Do not open a pack or bypass its protection system to obtain data.
Plot the trend before calculating a rate

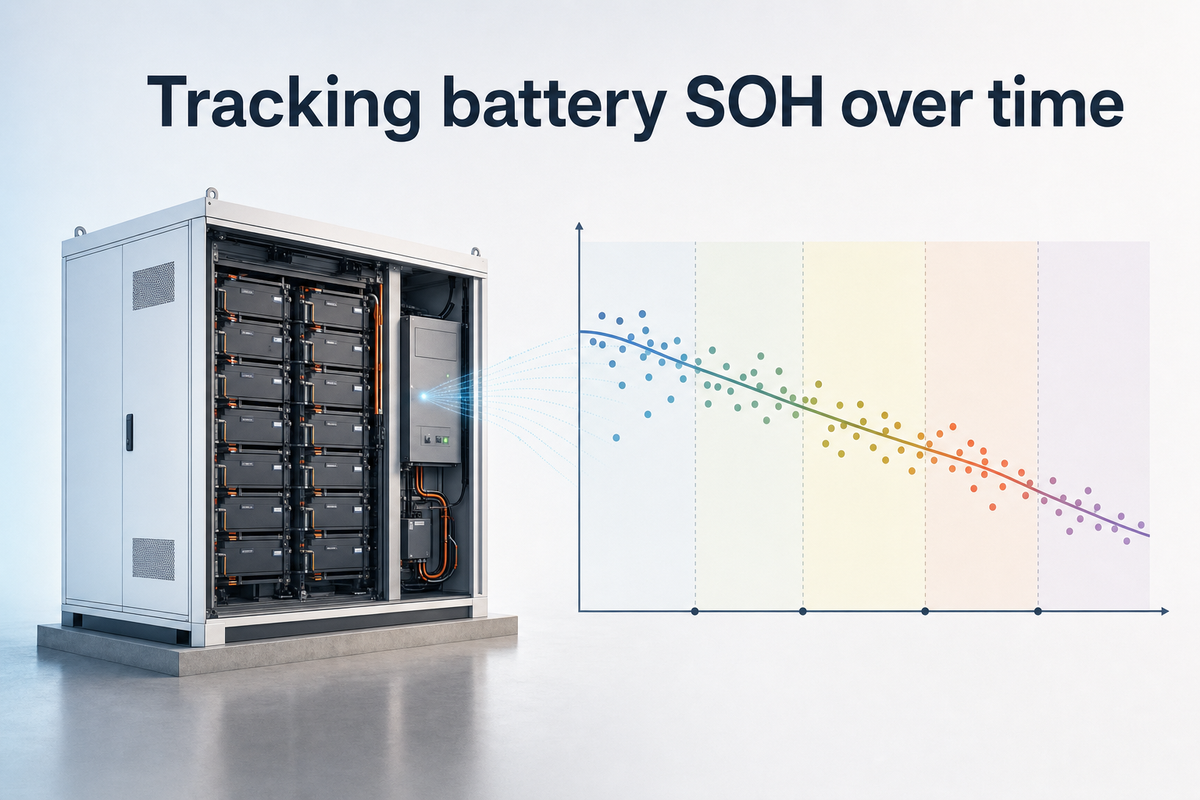
Start with a time-series chart:
- Put date or months in chronological order on the horizontal axis.
- Plot the reported SOH as points, not a smooth line that implies certainty.
- Add a second chart for capacity or runtime if you have those measurements.
- Mark firmware changes, sensor replacements, service events, and unusual temperature periods.
- Show the number of observations in each year so a “trend” is not really a comparison of one reading with twelve.
Then calculate a simple overall change:
Observed annual change = (last comparable SOH − first comparable SOH) ÷ elapsed years
This is a description of your history, not a forecast or a universal aging rate. For example, a drop from 96% to 88% over four years is an observed change of 2 percentage points per year. That summary hides the shape, so also compare shorter windows—such as the first half and second half of the record—and inspect whether the slope is stable.
A rolling median can make the underlying direction easier to see when readings are noisy. Keep the raw points visible and state the window used. Avoid fitting a complicated curve to a small dataset: it can make random variation look like a precise prediction.
Read the shape: gradual, stepped, seasonal, or accelerating
The pattern often tells you what to check next.
Gradual decline
A broad, steady downward movement with modest point-to-point variation is consistent with cumulative aging, but it does not identify the mechanism. Battery aging depends on chemistry and operating conditions. Researchers commonly distinguish calendar aging, which occurs with time, from cycling aging, which is associated with use; both can contribute according to this review of battery aging models.
Step change
A sudden drop followed by a new, relatively stable level deserves a measurement review before a battery diagnosis. Check for a new monitor, firmware update, changed reference capacity, different test temperature, altered cutoff, or a recalibration event. If independent capacity or runtime checks also shift, escalate the investigation to the manufacturer or a qualified technician.
Seasonal movement
If SOH falls in cold months and recovers in warmer conditions, the series may be reflecting temperature-dependent available capacity or estimation behavior rather than an equal amount of permanent aging each season. Compare like with like: similar temperature, load, state of charge, and test procedure. A seasonal pattern does not prove the battery is healthy, but it is a reason not to annualize one winter reading.
Acceleration
A persistently steeper decline in comparable readings is more concerning than one low point. First rule out a protocol or instrumentation change. Then review heat exposure, time spent at a high state of charge, deep or high-rate cycling, unusual loads, imbalance warnings, and storage conditions. Temperature, state of charge, and operating conditions are recognized influences on aging, but their effect varies by chemistry and design; do not apply a generic percentage penalty to your battery.
Flat or improving readings
A flat line can mean stable performance, a slow period, rounding, or an estimator that has not yet learned from enough data. An apparent improvement does not mean lost cell material has been restored. Treat it as improved estimation or changed operating conditions unless a controlled capacity test supports a different conclusion.
Separate aging from measurement noise
Use three questions for every surprising point:
- Was the measurement comparable? Check temperature, load, cutoff, state of charge, test duration, instrument, firmware, and data source.
- Does another signal agree? Compare SOH with measured capacity, delivered energy, runtime under a repeatable load, voltage behavior, and fault history. These are related but not interchangeable.
- Does the change persist? Repeat the same measurement under the same conditions before labeling a one-off value a degradation event.
Do not average away a safety warning or a genuine performance problem. An average is useful for trend description, not for dismissing symptoms such as swelling, unusual heat, odor, visible damage, repeated protection trips, or sudden loss of power. Stop using a suspect battery and seek qualified service according to the equipment and battery manufacturer’s guidance.
Turn the history into decisions

Set review rules before the next reading, using the battery’s documentation and operating role rather than a universal threshold. A practical monitoring plan can include:
- Routine review: update the record at a consistent interval and inspect raw points plus a rolling summary.
- Comparability check: repeat a controlled test after any unexplained step change or instrument replacement.
- Performance check: investigate when runtime, delivered energy, or load behavior changes materially even if displayed SOH does not.
- Escalation: contact the manufacturer or a qualified technician for persistent acceleration, large disagreement between indicators, repeated BMS faults, or physical and thermal warning signs.
- Replacement planning: use the documented warranty or application limit, expected required runtime, and consequence of failure—not SOH alone.
For a fleet or energy-storage site, report each battery separately before calculating group statistics. Include observation count, age, usage exposure, test conditions, and confidence notes. A median trend can summarize a population, but it should not conceal one battery with an abnormal trajectory.
A simple yearly review template
At the end of each year, save:
- the raw SOH readings and their source;
- a chart with comparable and non-comparable observations distinguished;
- the first and last comparable values;
- the elapsed time and observed annual change;
- capacity, runtime, temperature, and usage indicators when available;
- any equipment, firmware, service, or operating changes;
- the next test date and the condition that would trigger escalation.
This creates an audit trail. It also prevents a common mistake: comparing today’s algorithm-generated percentage with an old capacity-test result as though they were the same measurement.
The bottom line
A multi-year SOH trend is credible when the definition, measurement source, conditions, and battery history are recorded alongside the percentage. Look for persistent changes in slope, not drama in a single point. Use capacity or runtime evidence to test what the SOH estimate suggests, and treat temperature, usage, firmware, and instrumentation as part of the explanation. The result should be a decision record—what changed, how certain you are, and what you will check next—not a false-precision prediction of the battery’s final day.